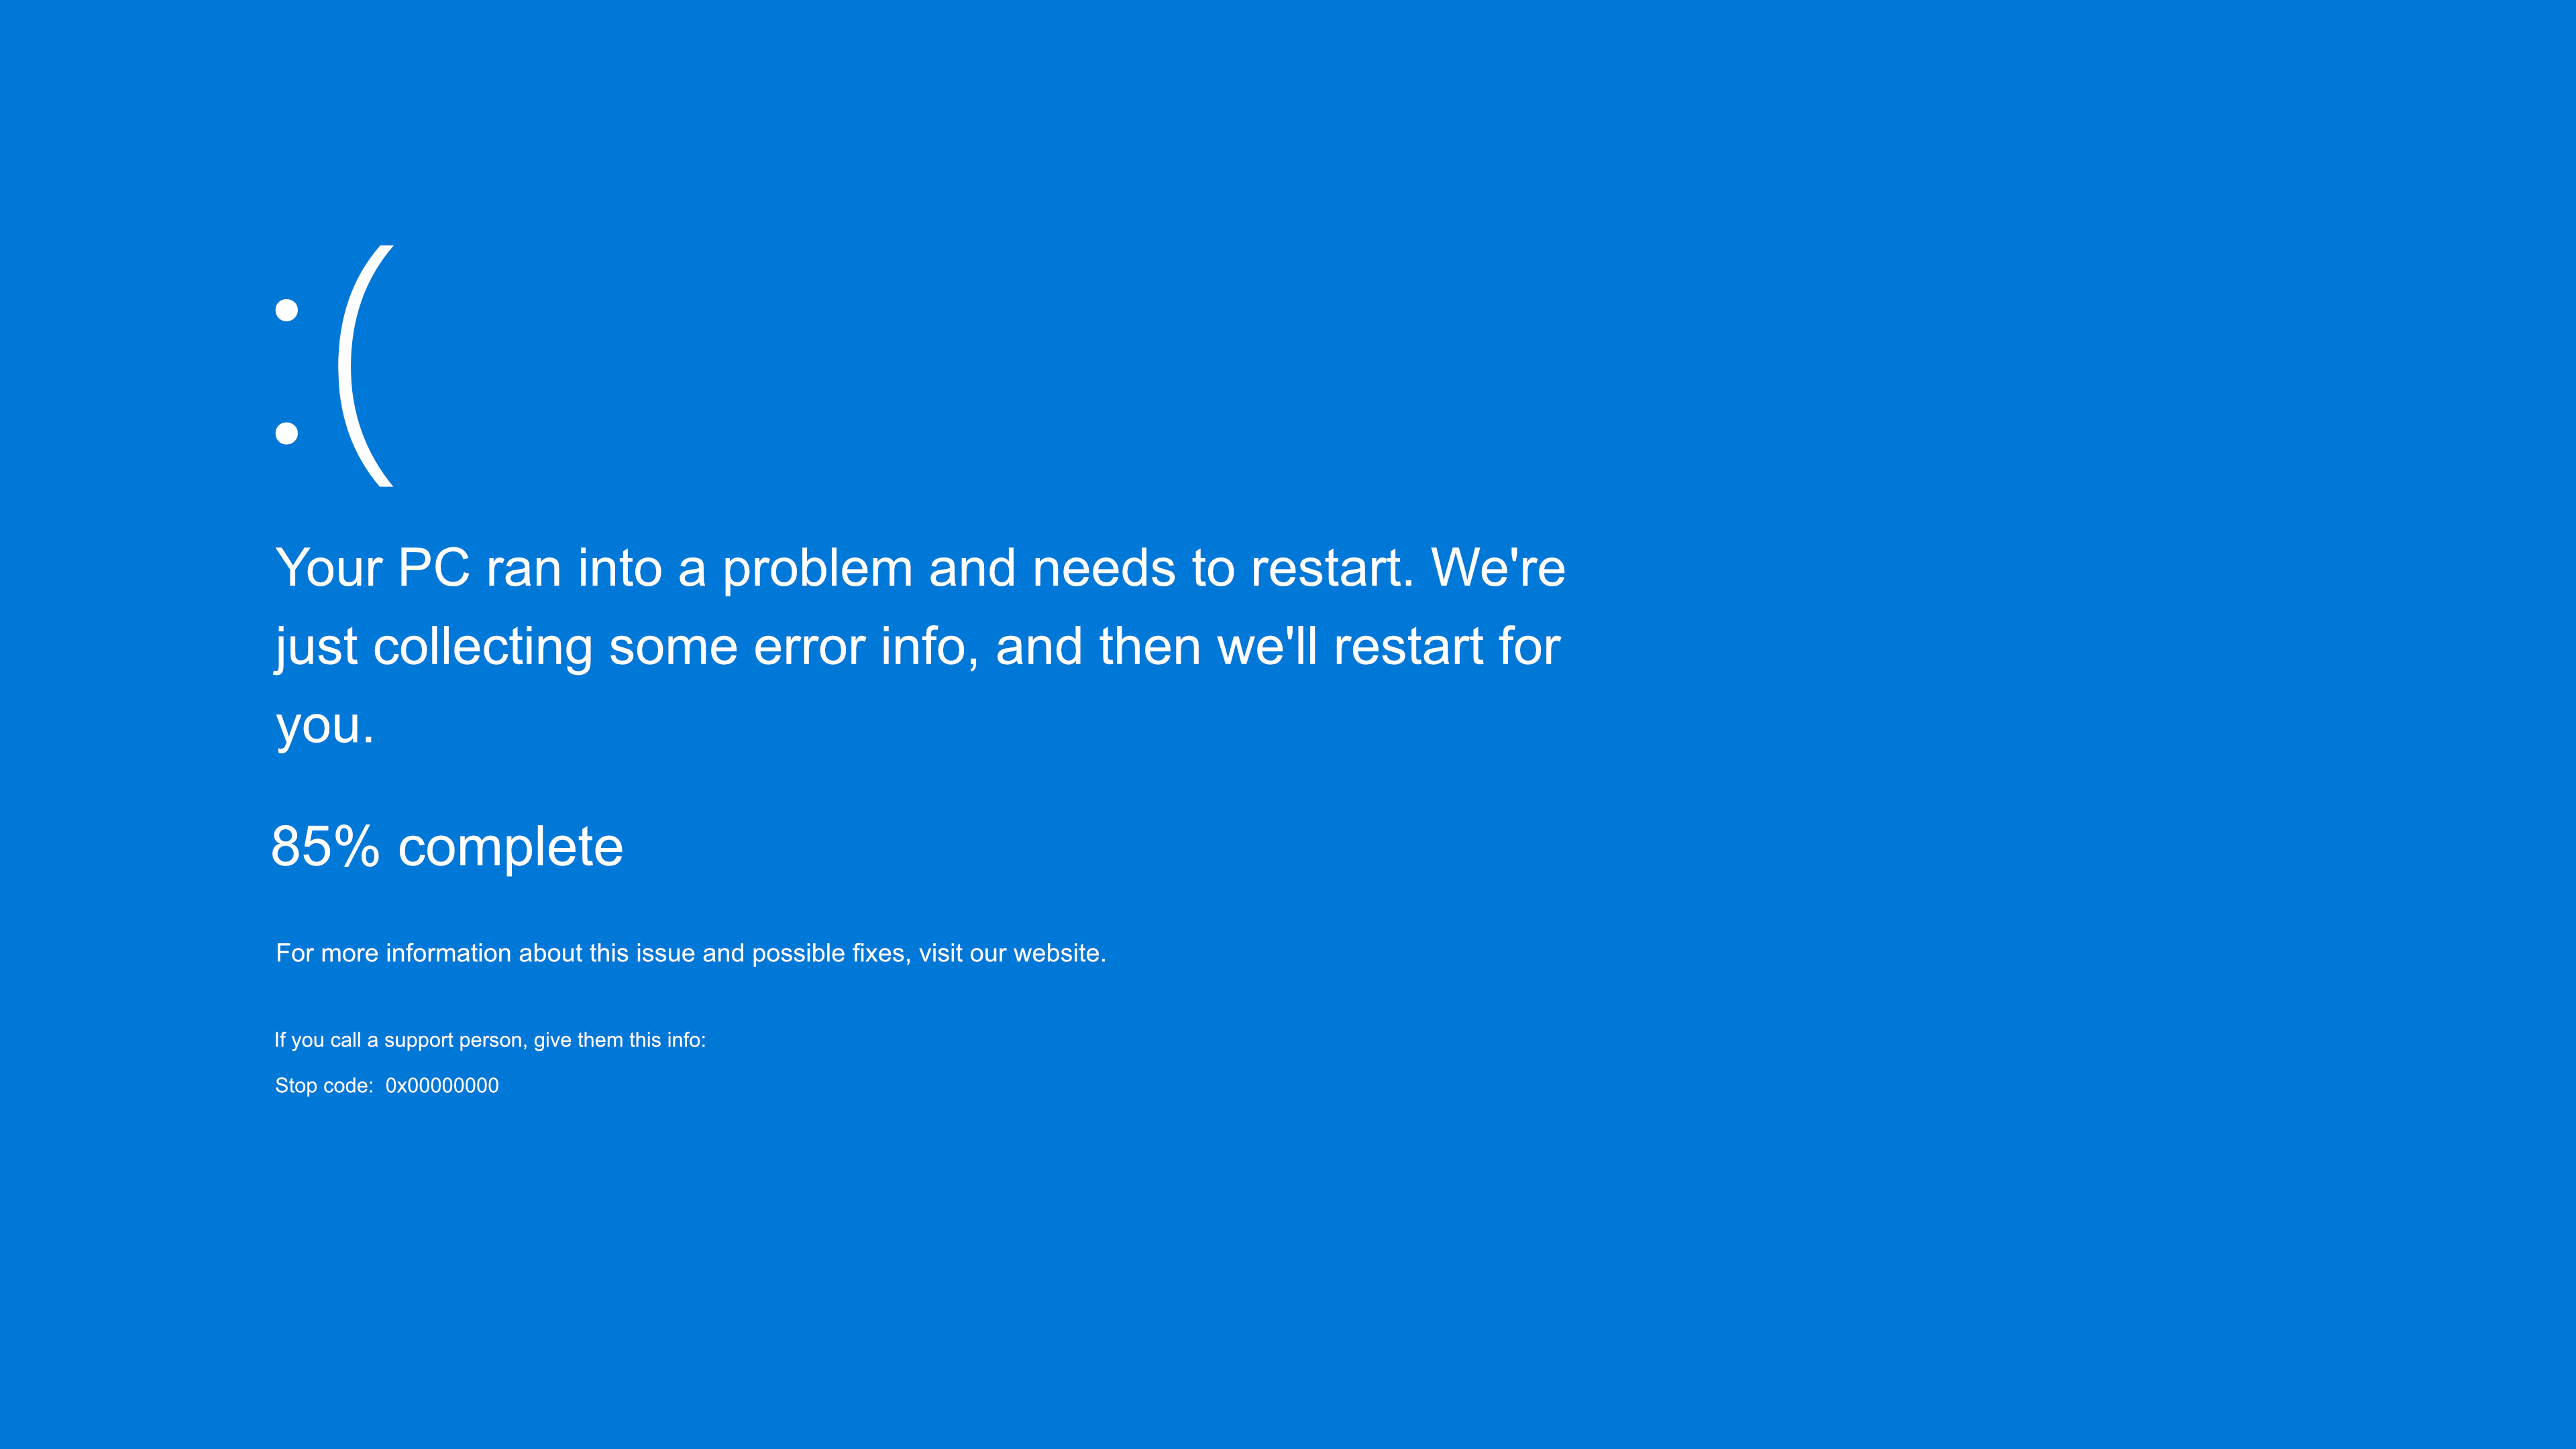
BlueScreenView is a diagnostic tool designed to help users analyze Blue Screen of Death (BSOD) crashes on Windows systems. When a computer crashes due to a critical error, Windows generates a minidump file containing details about the crash. BlueScreenView scans these dump files and extracts key information, such as error codes, faulty drivers, and crash timestamps, helping users understand the cause of the system failure.
By providing a clear and easy-to-read interface, BlueScreenView simplifies BSOD troubleshooting without requiring advanced technical knowledge. Instead of manually analyzing crash dumps with complex debugging tools, users can quickly identify problematic drivers and take the necessary steps to fix system stability issues.
How BlueScreenView Analyzes BSOD Crashes
When a Blue Screen of Death (BSOD) occurs, Windows generates a minidump file containing information about the crash. BlueScreenView analyzes these files to help users identify the cause of the crash. Below is a breakdown of how it works:
Scanning Minidump Files
After a system crash, Windows saves a minidump (.dmp) file that records details about the failure. BlueScreenView scans these files to extract relevant information.
Location of Crash Dump Files
Minidump files are typically stored in the following directory:
- C:\Windows\Minidump\
Users can manually access this location, but BlueScreenView automatically detects and lists these files for convenience.
How BlueScreenView Automatically Detects Them
When launched, BlueScreenView scans the default minidump directory and loads all available crash reports. It does this without requiring configuration, allowing users to instantly see past BSOD crashes.
Extracting Crash Information
Once the minidump files are scanned, BlueScreenView extracts key details to help diagnose the crash.
Error Codes and Bug Check Strings
Each BSOD has a bug check code (e.g., 0x0000007E) and a bug check string (e.g., SYSTEM_THREAD_EXCEPTION_NOT_HANDLED). These provide clues about the type of failure that occurred.
Faulty Driver or Module Identification
BlueScreenView highlights the specific driver or module that may have caused the crash. This helps users pinpoint faulty drivers, such as outdated or incompatible system files.
Stack Trace Analysis
In addition to basic crash information, BlueScreenView provides a stack trace to further investigate the crash.
Understanding the Call Stack to Pinpoint Errors
The call stack shows the sequence of function calls leading up to the crash. Advanced users can analyze this data to trace the exact point of failure within a driver or system process. This helps in identifying deeper system conflicts and debugging complex issues.
Interpreting BlueScreenView Results
Once BlueScreenView analyzes the minidump files, it presents the crash data in an easy-to-read format. Understanding the results is crucial for diagnosing and fixing system crashes. Below are key aspects of how to interpret the information provided.
Highlighting the Problematic Driver
BlueScreenView helps identify the specific driver or system file that caused the crash.
How to Identify the Suspect Driver
- The topmost driver in the crash report is often the main suspect.
- The “Caused by Driver” column indicates which driver is likely responsible.
- If multiple crashes show the same driver, it is a strong sign that the driver is faulty or outdated.
Color Coding and Indicators
BlueScreenView uses color coding to help users quickly identify problematic drivers and modules.
Meaning of Highlighted Rows
- Red or pink rows indicate the driver most likely responsible for the crash.
- Other rows show additional drivers involved in the crash but may not be the direct cause.
- System files are also listed but are often not the main issue unless specifically indicated.
Sorting and Filtering Data
To make the analysis more effective, BlueScreenView allows users to sort and filter crash reports.
Organizing Crash Reports for Better Insights
- Users can sort by date to identify the most recent crashes.
- Sorting by bug check codes helps find patterns in recurring errors.
- Filtering by specific drivers can pinpoint problematic hardware or software components.
Steps to Use BlueScreenView
BlueScreenView is a lightweight and user-friendly tool that requires no installation. Below are the steps to download, launch, and use the tool to analyze crash reports effectively.
Downloading and Launching the Tool
Before using BlueScreenView, you need to download and open the application.
Downloading BlueScreenView
- Visit the official NirSoft website to download BlueScreenView.
- Choose the appropriate version (32-bit or 64-bit) based on your Windows system.
- Download the ZIP file and extract its contents using a tool like WinRAR or Windows’ built-in extractor.
Launching BlueScreenView
BlueScreenView is a portable application, no installation is required.
Open the extracted folder and double-click the BlueScreenView.exe file to run the tool.
Navigating the Interface
Once the tool is open, you will see a simple interface displaying a list of crash reports.
Understanding the Main Window
- The top pane shows a list of minidump files detected on your system.
- The bottom pane displays detailed information about the selected crash, including drivers involved.
Customizing the View
- Use the View menu to enable or disable specific columns.
- Sort the crash reports by date, driver, or error code for better analysis.
Viewing and Analyzing Crash Reports
After navigating the interface, you can analyze the data to diagnose BSOD errors.
Identifying Key Crash Details
- Look at the Bug Check Code and Bug Check String to understand the error type.
- Check the Caused by Driver column to find the suspected faulty driver.
Investigating Recurring Issues
- If the same driver appears in multiple crashes, it may be corrupt or outdated.
- Compare crashes to see if a specific software update, driver installation, or system change caused instability.
Troubleshooting and Next Steps
How to Use Crash Data to Fix BSOD Errors
- Update or Roll Back Drivers: Update drivers via Device Manager or the manufacturer’s website. If issues started after an update, roll back to a previous version.
- Check for Windows Updates: Install updates to fix bugs and security issues.
- Run System File and Disk Checks: Use sfc /scannow for system files and chkdsk /f /r for disk errors.
Common Troubleshooting Tips
- Uninstall Problematic Software: Remove recently installed apps that may be causing conflicts.
- Run a Memory Test: Use Windows Memory Diagnostic to check for faulty RAM.
- Check Hardware Components: Inspect overheating or failing parts like the hard drive or graphics card.
Additional Tools for Deeper Analysis
- WinDbg: Advanced debugging tool for in-depth crash analysis.
- WhoCrashed: User-friendly tool that explains BSOD causes.
- Reliability Monitor: Built-in Windows tool to track crash patterns.
Conclusion
BlueScreenView is an essential tool for diagnosing Blue Screen of Death (BSOD) errors, allowing users to analyze minidump files and identify faulty drivers or system components. By presenting crash details in a clear and structured format, it helps users understand the root cause of system failures without needing advanced debugging knowledge. This makes troubleshooting BSOD errors more accessible, even for those with minimal technical experience.
BlueScreenView provides quick insights, fixing BSOD errors may require additional steps, such as updating drivers, checking for Windows updates, or running hardware diagnostics. Regular system maintenance and monitoring can help prevent future crashes and ensure system stability.

